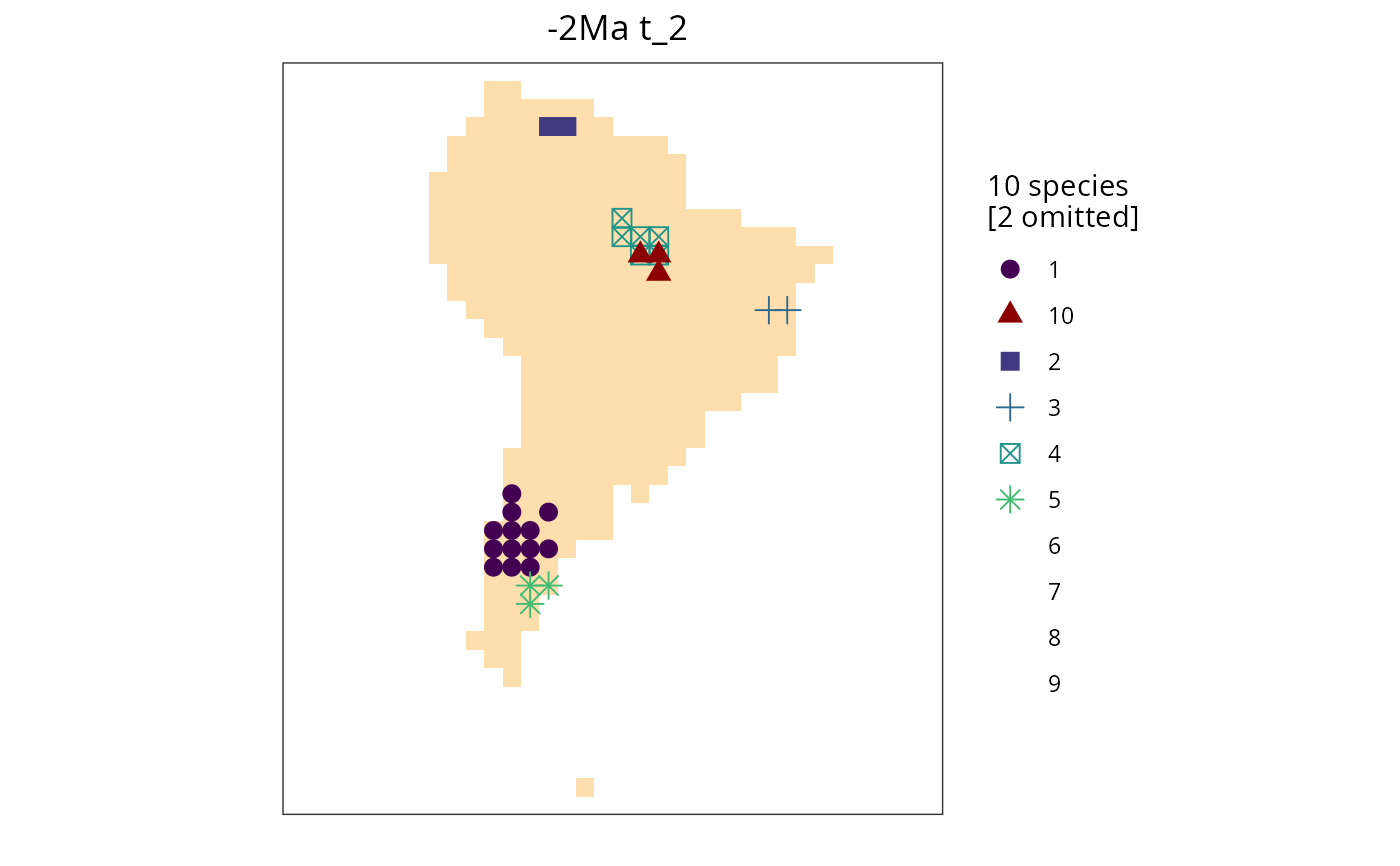
Plot species ranges of the given list of species on a space
Source:R/plotting_functions.R
plot_ranges.RdPlot species ranges of the given list of species on a space
Examples
library(gen3sis2)

all_species <- readRDS(system.file(
  "extdata/SouthAmerica/species_and_spaces/species_t_2.rds",
  package = "gen3sis2"
))
space <- readRDS(system.file(
  "extdata/SouthAmerica/species_and_spaces/space_t_2.rds",
  package = "gen3sis2"
))

plot_ranges(all_species, space)
#> Warning: The shape palette can deal with a maximum of 6 discrete values because more
#> than 6 becomes difficult to discriminate
#> ℹ you have requested 10 values. Consider specifying shapes manually if you need
#>   that many of them.
#> Warning: Removed 9 rows containing missing values or values outside the scale range
#> (`geom_point()`).