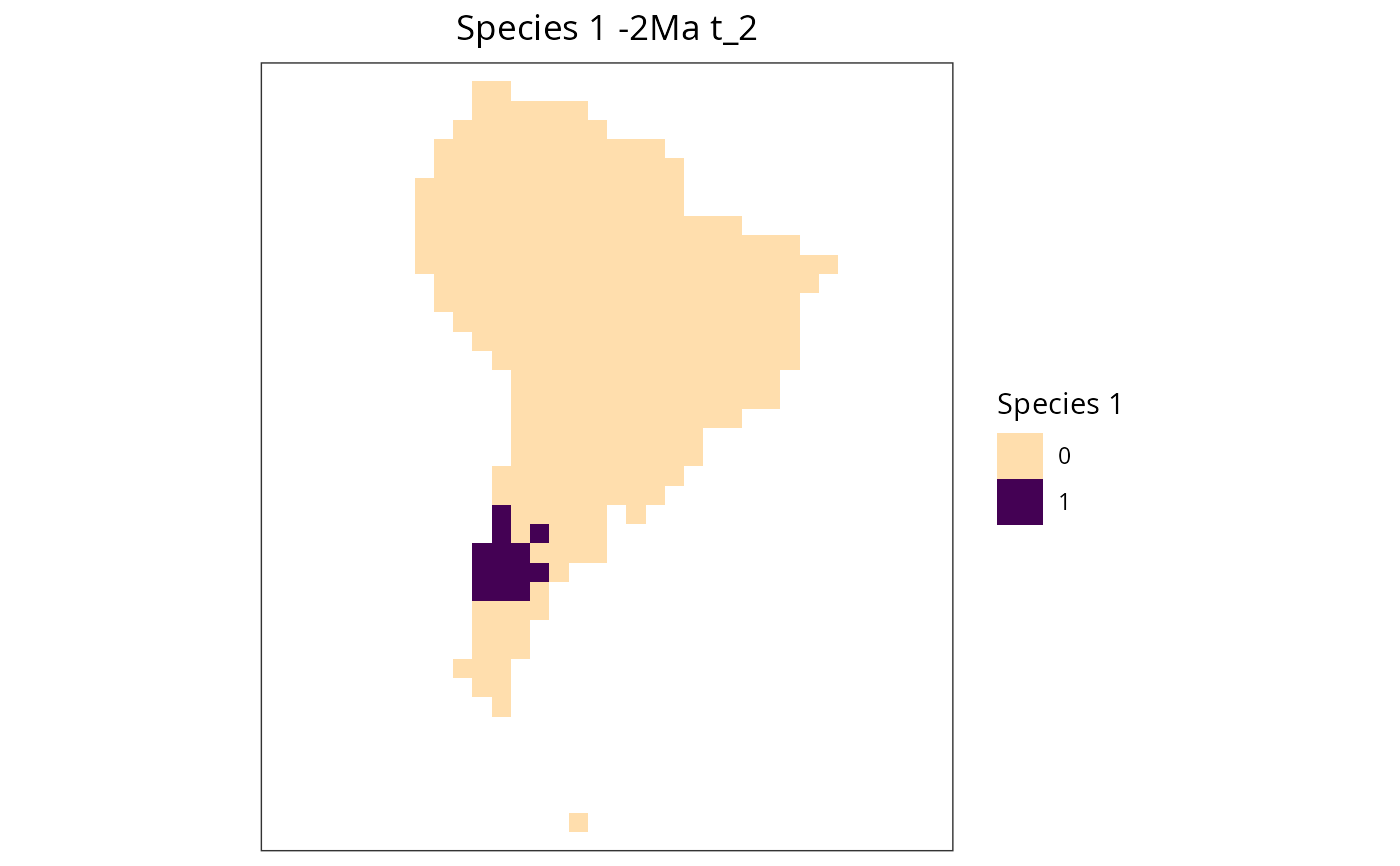
Plot a species' presence on a given space
Examples
library(gen3sis2)
all_species <- readRDS(system.file(
"extdata/SouthAmerica/species_and_spaces/species_t_2.rds",
package = "gen3sis2"
))
one_species <- all_species[[1]]
space <- readRDS(system.file(
"extdata/SouthAmerica/species_and_spaces/space_t_2.rds",
package = "gen3sis2"
))
plot_species_presence(one_species, space)
 library(gen3sis2)
all_species <- readRDS(system.file(
"extdata/SouthAmerica/species_and_spaces/species_t_2.rds",
package = "gen3sis2"
))
one_species <- all_species[[1]]
space <- readRDS(system.file(
"extdata/SouthAmerica/species_and_spaces/space_t_2.rds",
package = "gen3sis2"
))
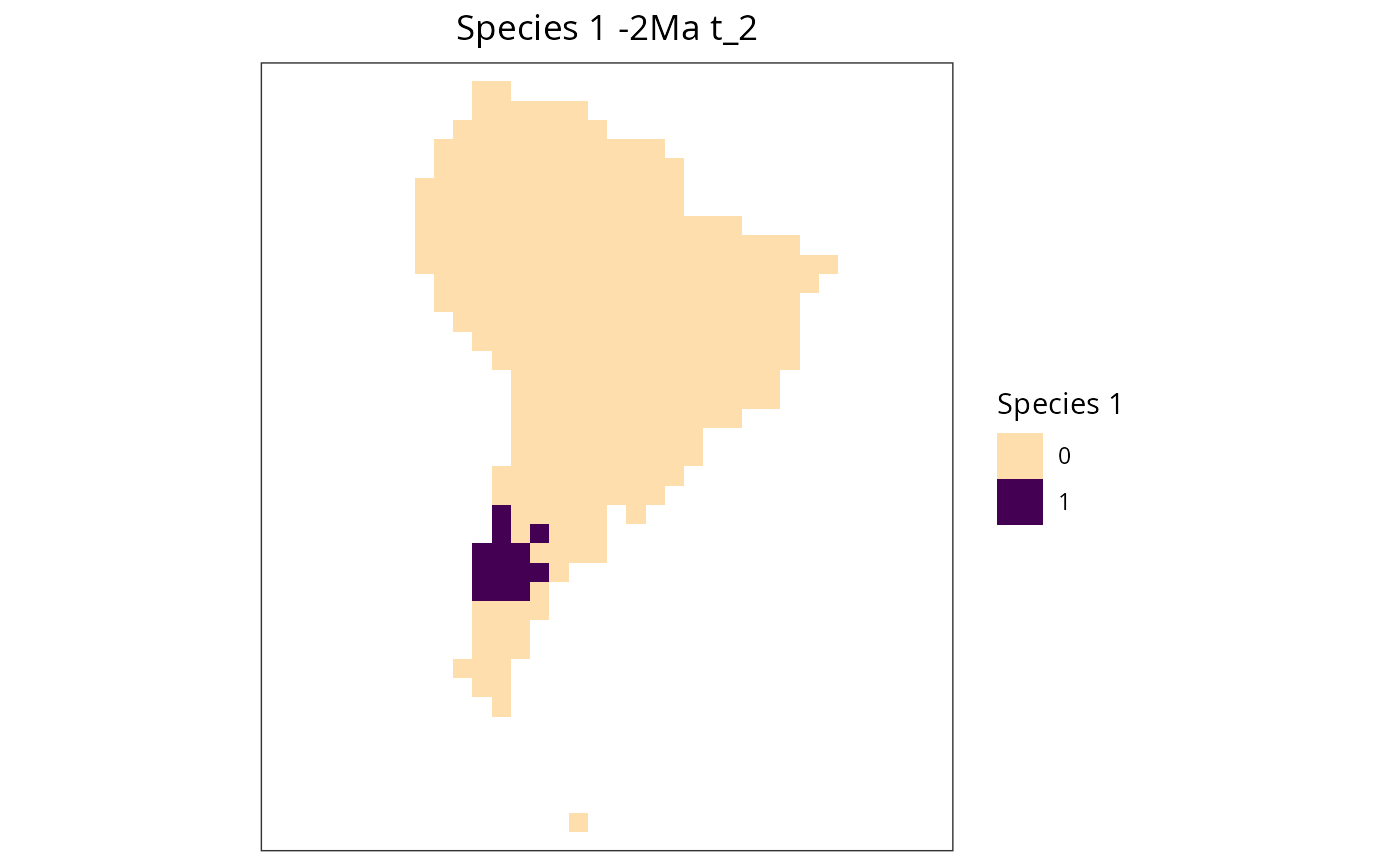
plot_species_presence(one_species, space)
library(gen3sis2)
all_species <- readRDS(system.file(
"extdata/SouthAmerica/species_and_spaces/species_t_2.rds",
package = "gen3sis2"
))
one_species <- all_species[[1]]
space <- readRDS(system.file(
"extdata/SouthAmerica/species_and_spaces/space_t_2.rds",
package = "gen3sis2"
))
plot_species_presence(one_species, space)